100-Year Flood or Drought: Why Do We Care?

9/20/23

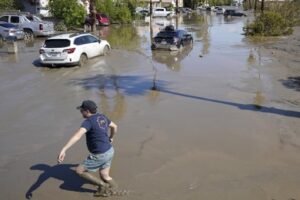
About a month ago, Southern California was hit by Tropical Storm Hilary, the first tropical storm to land in California in 84 years. On August 20, 2023, San Diego had its wettest day on record and Palm Springs set a new record for most rain in a single day. The rain from the storm resulted in flooding, mudflows, sinkholes, and power outages across southern California.

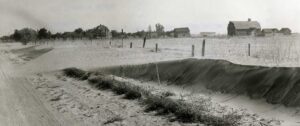
Flooding is a natural disaster that can result in loss of life or property, damage infrastructure, facilities, and agriculture, and affect water and wastewater supply and treatment.  When California was hit back in 1939 by a tropical storm, North Dakota was still experiencing a very different type of extreme weather: drought.  All through the 1930s, North Dakota (and the rest of the Midwest) experienced drought with 1934 and 1936 both setting records for the driest year on record.

One of the ways extreme weather can be categorized is through frequency analysis. The term 100-year flood or 500-year flood might come to mind. This does not mean that an event like the one that just happened in California will only occur once every 10 or 500 years, but rather that the recurrence interval, or chance of it happening in a given year, is 1 in 100 (1%) or 1 in 500 (0.2%). This same idea can also be used to define droughts (chances of it occurring in a certain time frame); however, droughts tend to happen over longer periods when compared to floods. The amount (or lack) of water making up a 100-year flood (or drought) are what engineers use in their planning considerations and design calculations.

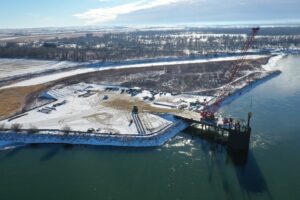
Engineers use these extreme weather events, such as the flood in California and the 1930’s drought in North Dakota, when they design flood mitigation or drought resiliency projects. Currently, the Burian and Associates team is part of the consulting team for the Red River Valley Water Supply Project (RRVWSP). When fully constructed, this project will deliver water from the Missouri River in the McClusky Canal via pipeline to the Sheyenne River for communities and rural water districts in central and eastern North Dakota to combat drought and support economic development. Through modeling efforts for the project, our team is using historical information across several climate indicators (including drought and flood years) to analyze water availability leading up to, during, and following drought years.

The RRVWSP is currently under construction and received generous funding support from the North Dakota Legislature in 2023. When completed, the RRVWSP will provide drought resiliency and support economic development for nearly half of the residents in North Dakota. The Burian and Associates Team is excited to be part of and lend their expertise to this very impactful project.


Sources:

Flood. (2023). Water.ca.gov; California Department of Water Resources. https://water.ca.gov/Water-Basics/Flood

Hilary live updates: Storm slams California with flash floods. (2023, August 21). NBC News. https://www.nbcnews.com/news/us-news/live-blog/hilary-live-updates-storm-california-rcna100908

Jones, D. (2023, August 18). Hilary could be the first tropical storm to hit California in more than 80 years. NPR. https://www.npr.org/2023/08/18/1194588117/hilary-could-be-the-first-tropical-storm-to-hit-california-in-more-than-80-years

Petri, A., Toohey, G., & Zahniser, D. (2023, August 21). Hilary leaves massive flooding, mudslides, upheaval across Southern California. Los Angeles Times. https://www.latimes.com/california/story/2023-08-21/hilary-moves-out-of-southern-california-leaving-massive-flooding

Robinson, E. (2017). Chapter 18. In History of North Dakota (pp. 396–416). Open Educational Resources.

Water Science School. (2018). The 100-Year Flood. USGS. https://www.usgs.gov/special-topics/water-science-school/science/100-year-flood

The COVID-19 Financial Impact on Drinking Water Utilities

A recent report prepared by Raftelis for the American Water Works Association (AWWA) and the Association of Metropolitan Water Agencies estimated the financial impact of the coronavirus pandemic on U.S. water utilities. The report estimates drinking water utilities will suffer a loss in revenue of $13.9 billion; this equates to approximately 17% of the 2018 U.S. drinking water sector revenue total.

The financial impact on the drinking water sector will translate to further impacts on the entire U.S. economy. According to the report, the financial impacts will result in drinking water utilities across the U.S. to delay and reduce capital expenditures to help manage cash during and after the pandemic. The delay in capital expenditures will have a negative effect on economic activity in communities across the U.S., including but not limited to loss of jobs and increased infrastructure failures. It is estimated that communities will experience a reduction in economic activity by as much as $32.7 billion (annualized).

The estimated financial losses are based on data obtained from utility survey respondents of current and anticipated financial impacts, as well as general drinking water sector and U.S. census information.

Analysis Components

The analysis consisted of the following components to estimate the financial impact on the US drinking water industry (estimated financial impact bolded):

  1. Financial Losses due to Changes in Utility Policies
    Includes considerations for not shutting off water service to customers with delinquent accounts and providing forgiveness of late penalty fees. Net loss of $5.49B
  2. Revenue Loss due to Reduced Consumption
    Includes considerations for loss in revenue from non-residential customers (i.e. commercial, industrial, institutional, etc.) and increase in revenue from residential customers caused by stay at home orders for non-essential workers. Net loss of $4.74B
  3. Financial Impact of Operational Policy Changes
    Includes considerations for new operational policies such as new or additional operating hours for essential water utility staff, isolating operations staff, and providing increased compensation for essential employees (i.e. hazard pay). Net loss of $0.63B
  4. Financial Loss Due to Slower Development and Growth
    Includes considerations for a slowdown in growth and new development, which further negatively impacts the revenues of drinking water utilities. Net loss of $3.01B
  5. Economic Impact from Reduced and Delayed Capital Expenditures
    Includes considerations for reducing and/or delaying capital expenditures in order to manage cash. This component estimated total economic loss but specific loss to water utilities was not quantified

Conclusion

The total estimated financial impact on U.S. drinking water utilities is shown in the table below.

Description

Annualized Financial Impact

Marginal Cost of Non-Shut Offs $0.57 B
Revenue Loss Due to Increased Delinquencies $4.92 B
Reduction in Commercial Revenues $7.38 B
Increase in Residential Revenues ($2.64) B
Increase in Personnel Expenses $0.63 B
Reduction in System Development Charges $2.60 B
Reduction in Revenues from Reduced Customer Growth $0.41 B
Aggregate Financial Impact $13.87 B


Water utilities may suffer additional future revenue losses estimated at approximately $1.6 billion as a result of delaying once planned rate increases. These numbers do not include projected financial losses for wastewater utilities, which has been estimated at $12.5 billion according to the report, bringing the combined water sector and wastewater sector estimated financial impact to over $27 billion.

The information, data, and analysis used to prepare this article was obtained from the report – “The Financial Impact of the COVID-19 Crisis on Drinking Water Utilities,” prepared by Raftelis for the American Water Works Association and the Association of Metropolitan Water Agencies.